How does your newsletter’s open rate compare to others?
Usually that’s a hard question to answer. But because GlueLetter newsletter analytics provides advanced newsletter data analysis for dozens of leading news publishers, we have exclusive access to email engagement trends across the newsletter industry.
This analysis includes:
- more than 9,000 email campaigns
- nearly 500 different newsletter products
- 255 million opens
- 25.5 million clicks
- Data from a variety of ESPs including Mailchimp, Sailthru, ActiveCampaign, HubSpot, Campaign Monitor, Constant Contact, Iterable, Cordial, Pardot, Sendgrid, and others
…that we tracked between Jan. 1 to March 31 of 2025.
See why so many leading publishers turn to GlueLetter to supercharge their email data analysis
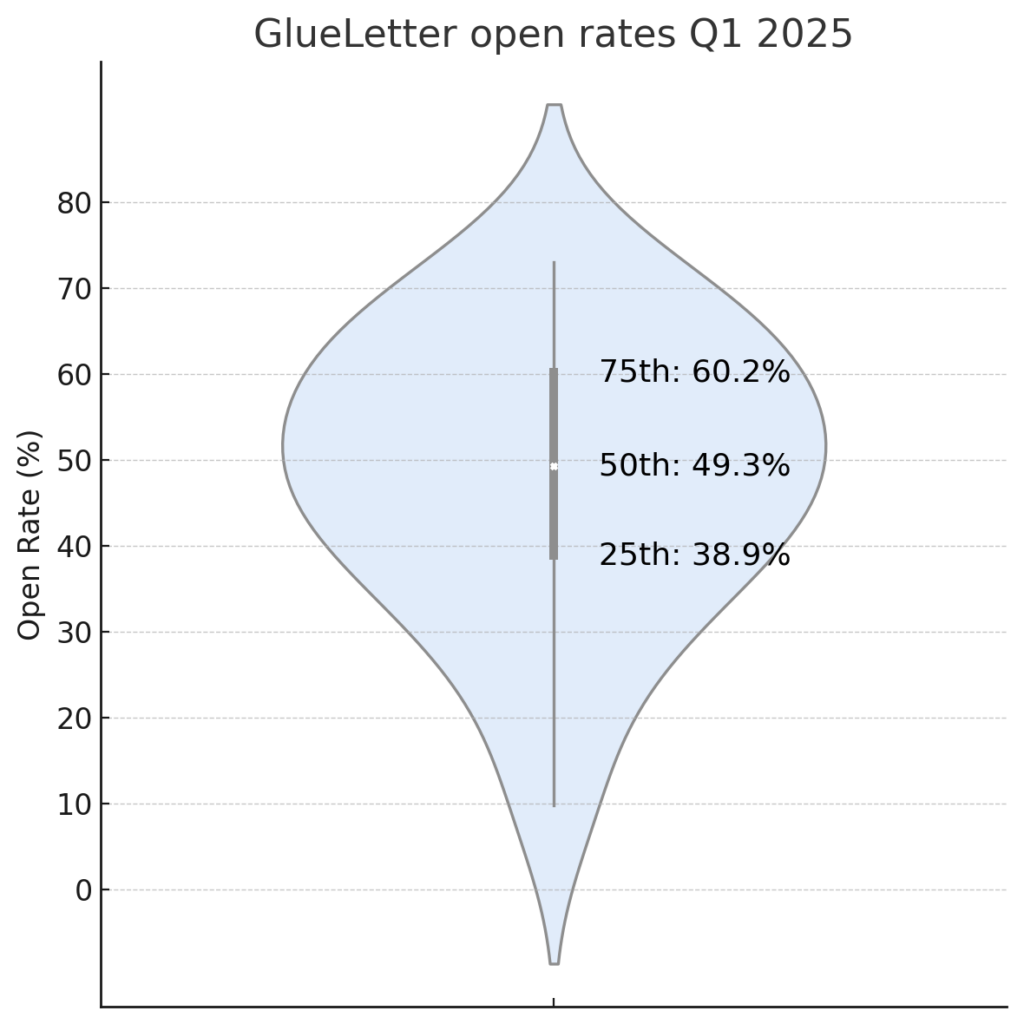
Open rate averages
The median open rate across all newsletter campaigns in Q1 of 2025 was 49.3%.
The middle half of campaigns recorded an open rate somewhere between 38.9% and 60.2%. Which means if your open rate was above 60% you are in the top 25% of newsletters, and if you are below 39% you are in the bottom 25%.
| Your open rate… | GlueLetter’s evaluation… |
| 22% | Poor (bottom 10% of newsletters) |
| 37% | Lagging (bottom 25% of newsletters) |
| 49% | Normal (better than 50% of newsletters) |
| 61% | Great (better than 75% of newsletters) |
| 69% | Super (better than 90% of newsletters) |
Methodology
Open Rate: GlueLetter calculates this as the email’s unique opens as a percentage of sends. It is the percentage of all recipients who opened the email at least one time.
Privacy related opens: This analysis does NOT exclude any opens from Apple’s MPP, Google image caching, or other similar programs.
Detailed percentiles breakdown for open rates
If you want to get more specific, here are the open rates GlueLetter recorded at percentiles from 5% up to 95%. For example, if your score is near the “40th percentile” that means your open rate is higher than 40% of other newsletters (and lower than the other 60%).
| Open rate | Percentile |
| 9.81% | 5th percentile |
| 22.47% | 10th percentile |
| 29.03% | 15th percentile |
| 34.29% | 20th percentile |
| 37.40% | 25th percentile |
| 40.39% | 30th percentile |
| 42.84% | 35th percentile |
| 45.04% | 40th percentile |
| 47.16% | 45th percentile |
| 49.33% | 50th percentile |
| 51.71% | 55th percentile |
| 54.12% | 60th percentile |
| 56.37% | 65th percentile |
| 58.92% | 70th percentile |
| 61.50% | 75th percentile |
| 64.13% | 80th percentile |
| 66.42% | 85th percentile |
| 68.96% | 90th percentile |
| 73.03% | 95th percentile |
More data
Other metrics: See our similar benchmarking data about Click Rates. We will soon a publish similar analysis of benchmarking trends for Unsubscribe Rates.
Future updates
We plan to update these datasets at the end of each quarter (every three months). Sign up for email updates below, and follow GlueLetter and our founder Jeff Sonderman on LinkedIn for regular updates.
Try GlueLetter for your newsletters
Connect your existing ESP to GlueLetter to unlock loads of advanced data analysis and tools.